
Introduction
For a growing number of people, data science is a central part of their job. Increased data availability, more powerful computing, and an emphasis on analytics-driven decision in business has made it a heyday for data science. According to a report from IBM, in 2015 there were 2.35 million openings for data analytics jobs in the US. It estimates that number will rise to 2.72 million by 2020.
The two most popular programming tools for data science work are Python and R at the moment (take a look at this Data Science Survey conducted by O’Reilly). It is hard to pick one out of those two amazingly flexible data analytics languages. Both are free and and open source, and were developed in the early 1990s — R for statistical analysis and Python as a general-purpose programming language. For anyone interested in machine learning, working with large datasets, or creating complex data visualizations, they are absolutely essential.
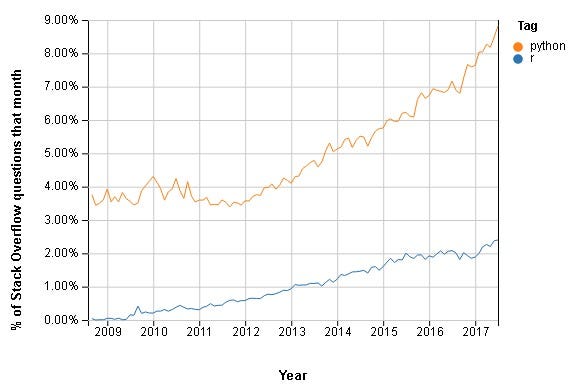
Image Source: https://dzone.com/articles/r-or-python-data-scientists-delight
The graph above shows how Python and R have trended over time based on the use of their tags since 2008 (Stack Overflow was founded).
While both languages are competing to be the data scientist’s language of choice, let’s look at their platform share and compare 2016 with 2017.
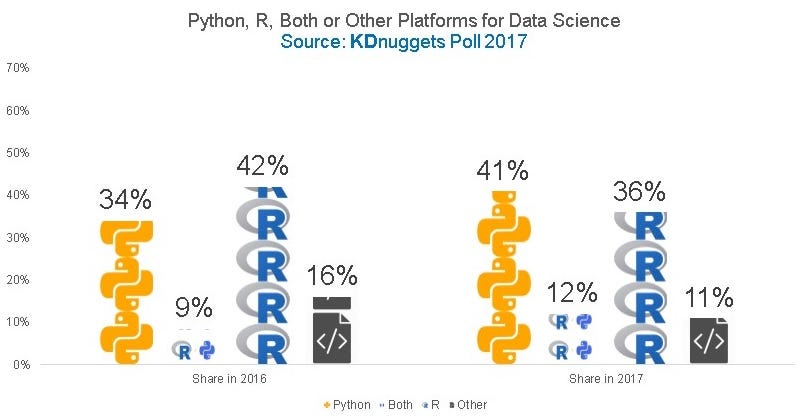
Image Source: https://dzone.com/articles/r-or-python-data-scientists-delight
A Brief Overview of Python and R History
Python
Python was released in 1989 with a philosophy that emphasizes code readability and efficiency. It is an object-oriented programming language, which means it groups data and code into objects that can interact with and modify one another. Java, C++, and Scala are other examples. This sophisticated approach allows data scientists to execute tasks with better stability, modularity, and code readability.
Data science is only a small portion within the diverse Python ecosystem. Python’s suite of specialized deep learning and other machine learning libraries includes popular tools like scikit-learn, Keras, and TensorFlow, which enable data scientists to develop sophisticated data models that plug directly into a production system.
R
R was developed in 1992 and was the preferred programming language of most data scientists for years. It is a procedural language which works by breaking down a programming task into a series of steps, procedures, and subroutines. This is a plus when it comes to building data models because it makes it relatively easy to understand how complex operations are carried out; however, it is often at the expense of performance and code readability.
R’s analysis-oriented community has developed open-source packages for specific complex models that a data scientist would otherwise have to build from scratch. R also emphasizes quality reporting with support for clean visualizations and frameworks for creating interactive web applications. On the other hand, slower performance and a lack of key features like unit testing and web frameworks are common reasons that some data scientists prefer to look elsewhere.
Process of Data Science
Now, it is time to look at these two languages a little bit deeper regarding their usage in a data pipeline, including:
- Data Collection
- Data Exploration
- Data Modeling
- Data Visualization
Data Collection
Python
Python supports all kinds of different data formats. You can play with comma-separated value documents (known as CSVs) or you can play with JSON sourced from the web. You can import SQL tables directly into your code.
You can also create datasets. The Python requests library is a beautiful piece of work that allows you to take data from different websites with a line of code. It simplifies HTTP requests into a line of code. You’ll be able to take data from Wikipedia tables, and once you’ve organized the data you get with beautifulsoup, you’ll be able to analyze them in-depth.
You can get any kind of data with Python. If you’re ever stuck, google Python and the dataset you’re looking for to get a solution.
R
You can import data from Excel, CSV, and from text files into R. Files built in Minitab or in SPSS format can be turned into R data frames as well. While R might not be as versatile at grabbing information from the web like Python is, it can handle data from your most common sources.
Many modern packages for R data collection have been built recently to address this problem. Rvest will allow you to perform basic web scraping, while magrittr will clean it up and parse the information for you. These packages are analogous to the requests and beautiful soup libraries in Python.
Data Exploration
Python
To unearth insights from the data, you’ll have to use Pandas, the data analysis library for Python. It can hold large amounts of data without any of the lag that comes from Excel. You’ll be able to filter, sort and display data in a matter of seconds.
Pandas is organized into data frames, which can be defined and redefined several times throughout a project. You can clean data by filling in non-valid values such as NaN (not a number) with a value that makes sense for numerical analysis such as 0. You’ll be able to easily scan through the data you have with Pandas and clean up data that makes no empirical sense.
R
R was built to do statistical and numerical analysis of large data sets, so it’s no surprise that you’ll have many options while exploring data with R. You’ll be able to build probability distributions, apply a variety of statistical tests to your data, and use standard machine learning and data mining techniques.
Basic R functionality encompasses the basics of analytics, optimization, statistical processing, optimization, random number generation, signal processing, and machine learning. For some of the heavier work, you’ll have to rely on third-party libraries.
Data Modeling
Python
You can do numerical modeling analysis with Numpy. You can do scientific computing and calculation with SciPy. You can access a lot of powerful machine learning algorithms with the scikit-learn code library. scikit-learn offers an intuitive interface that allows you to tap all of the power of machine learning without its many complexities.
R
In order to do specific modeling analyses, you’ll sometimes have to rely on packages outside of R’s core functionality. There are plenty of packages out there for specific analyses such as the Poisson distribution and mixtures of probability laws.
Data Visualization
Python
The IPython Notebook that comes with Anaconda has a lot of powerful options to visualize data. You can use the Matplotlib library to generate basic graphs and charts from the data embedded in your Python. If you want more advanced graphs or better design, you could try Plot.ly. This handy data visualization solution takes your data through its intuitive Python API and spits out beautiful graphs and dashboards that can help you express your point with force and beauty.
You can also use the nbconvert function to turn your Python notebooks into HTML documents. This can help you embed snippets of nicely-formatted code into interactive websites or your online portfolio. Many people have used this function to create online tutorials on how to learn Python and interactive books.
R
R was built to do statistical analysis and demonstrate the results. It’s a powerful environment suited to scientific visualization with many packages that specialize in graphical display of results. The base graphics module allows you to make all of the basic charts and plots you’d like from data matrices. You can then save these files into image formats such as jpg., or you can save them as separate PDFs. You can use ggplot2 for more advanced plots such as complex scatter plots with regression lines.
Questions to Ask Before Choosing One of the Languages
1 — Do you have experience programming in other languages?
If you have some programming experience, Python might be the language for you. Its syntax is more similar to other languages than R’s syntax is. Python can be read much like a verbal language. This readability emphasizes development productivity, while R’s unstandardized code might be a hurdle to get through in the programming process.
2 — Do you want to go into academia or industry?
The real difference between Python and R comes in being production ready. Python is a full-fledged programming language and many organizations use it in their production systems. On the other hand, R is a statistical programming software favoured by many academia. Only recently due to the availability of open-source R libraries that the industry has started using R.
3 — Do you want to learn “machine learning” or “statistical learning”?
Machine learning is a subfield of Artificial Intelligence, while Statistical Learning is a subfield of Statistics. Machine learning has a greater emphasis on large-scale applications and prediction accuracy; while statistical learning emphasizes models and their interpretability, and precision and uncertainty.
Since R was built as a statistical language, it suits much better to do statistical learning. It represents the way statisticians think pretty well, so anyone with a formal statistics background can use R easily. Python, on the other hand, is a better choice for machine learning with its flexibility for production use, especially when the data analysis tasks need to be integrated with web applications.
4 — Do you want to do a lot of software engineering?
Python is for you. It integrates much better than R in the larger scheme of things in an engineering environment. However, to write really efficient code, you might have to employ a lower-level language such as C++ or Java, but providing a Python wrapper to that code is a good option to allow for better integration with other components.
5 — Do you want to visualize your data in beautiful graphics?
For rapid prototyping and working with datasets to build machine learning models, R inches ahead. Python has caught up some with advances in Matplotlib but R still seems to be much better at data visualization (ggplot2, htmlwidgets, Leaflet).
Conclusion
Python is a powerful, versatile language that programmers can use for a variety of tasks in computer science. Learning Python will help you develop a versatile data science toolkit, and it is a versatile programming language you can pick up pretty easily even as a non-programmer.
On the other hand, R is a programming environment specifically designed for data analysis that is very popular in the data science community. You’ll need to understand R if you want to make it far in your data science career.
The reality is that learning both tools and using them for their respective strengths can only improve you as a data scientist. Versatility and flexibility are traits any data scientist at the top of their field. The Python vs R debate confines you to one programming language. You should look beyond it and embrace both tools for their respective strengths. Using more tools will only make you better as a data scientist.
Bottom Line: Both languages are winners..
Additional Resources:
- Should you teach Python or R for data science? (DataSchool, Feb 2015)
- R vs Python for Data Science: The Winner Is (DataCamp, May 2015)
- Data Science Sexiness: Your guide to Python and R, and which one is best (The Next Web, April 2016)
- R vs Python (Dzone, Oct 2017)